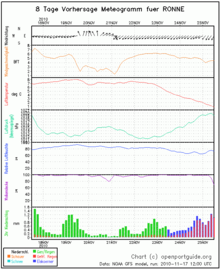
Meteogram
There is a comprehensive meteogram for each of the 5000 harbours worldwide and a weather forecast for 8 days.
These are the parameters:
- direction of wind
- wind force
- barometric pressure
- relative humidity
- air temperature
- precipitation
Simply click on the harbour symbol and follow the weather link.
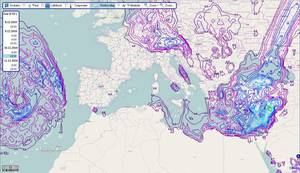
Weather chart worldwide
The entire nautical chart shows the following: wind, barometric pressure, air temperature, precipitation and wave height. The weather charts are shown either individually or one above the other. There is a forecast for the next 3 days for each of the parameters for a total of 8 points in time. Zoom level 4 gives you an overview over the general weather situation. Zoom levels 5, 6 and 7 give you more detailed information. The weather charts show the weather in all sea areas and on all continents worldwide.
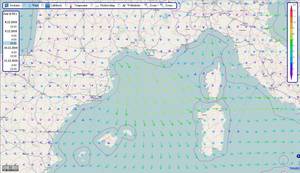
Wind map
We provide a wind map worldwide including a weather forecast for 3 days plus 2 to 3 daily forecasts. The wind arrows show the direction of the wind as well as the wind force by using different lengths and colours. Red for example means a storm, yellow is for strong winds, green and blue represent moderate winds and purple a light breeze or calm.
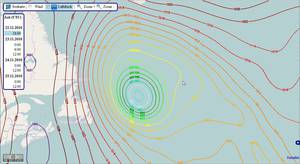
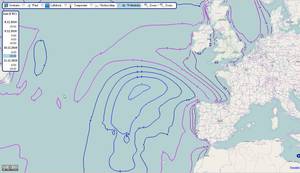
Barometric map
The barometric map or isobar map shows the distribution of pressure worldwide using isobars and offers three-day forecasts. Low and high pressure areas can be identified easily. If you consult both the temperature map and the precipitation map, the weatherfront can be recognised particularly well.
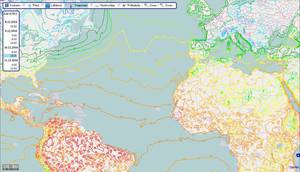
Air temperature map
The temperature of the air is depicted as temperature lines. You can easily see where the weather is suitable for bathing or where there is snow. The curves of the lines represent the course of the fronts, i. e. where warm and cold air masses clash.
Precipitation map
Precipitation includes rain, snow and hail. Rainy and dry areas can be recognised easily as well as the precipitation in front of the warm front and behind the cold front plus the thunderstorm zones. With the three- day forecast you can easily follow the shift of the fronts.
Wave height map
Shows wave heights and three-day forecasts for all sea areas.